1. INTRODUCTION
Starch is a homopolysaccharide carbohydrate consisting of a large number of glucose units joined by glycosidic linkage. Starch is used in tablets formulations as filler, binder and as a disintegrant (Adebayo and Itiola, 1998). Starches from different sources do not have similar properties that are needed for them to function as tablet excipients (Bos et al., 1887). The choice of binders in a tablet formulation is based on their ability to impart cohesiveness to the formulation and compatibility with other ingredient including the active ingredients (Ibezim et al., 2011). In most cases the binder type and concentration have been shown to have direct effect on formulation properties such friability, hardness (crushing strength), disintegration time and dissolution time. Potato starch i.e. starch from Solanum tuberosum is widely used in tablets because it has good compression properties (Lieberman et al., 1980, Juslin et al., 1981). However, potato is grown mainly in the western countries and to use it in tropical countries means to import it from western countries.
Starch can be got from other sources such as sweet potatoes, Zea mays, rice or cassava which are grown in tropical countries. Starches from these sources have different gelling, swelling and water sorption properties which determine their use as binders, disintegrants and fillers (Adebayo and Itiola 1998, Okunola and Odeku 2011). Studies of starch properties as they affect formulations provide us with alternatives to currently available excipients.
Ipomoea batatas (sweet potato) is a dicotyledonous plant belonging to the family of Convolvulaceae. Developing counties are responsible for 98 % of world output. It has sweet tasting tuberous roots which are made up of 65 – 85 % starch and starch recovery varied from 70.6 – 96.5% (Rahman et al; 2003). Ipomoea batatas (sweet potato) is distantly related to Solanum tuberosum (potato) which belongs to the family of Solanaceae but both of them belong to the same taxonomic order of Solanales (CFIA, 2019).
Ethambutol is a bacteriostatic agent with specific activity against Mycobacterium tuberculosis. It is used in combination with other drugs like isoniazid, rifampicin, pyrazinamide and streptomycin to treat infections caused M. tuberculosis and other mycobacteria species such as Mycobacterium kansasii and the mycobacterium responsible for Mycobacterium avium complex. It is an inhibitor of mycobacterial arabinosyl tranferases which are involved in the polymerization reaction of arabinoglycan an essential component of the mycobacterial cell wall (Katzung, 2001). The effectiveness of sweet potato starch as a binder in ethambutol tablet formulations was evaluated to provide a possible alternative to maize and potato starches that are imported into the country. Ethambutol cannot be directly compressed into tablets with good crushing strength and there is therefore the need for a binder and other tablet excipients to ensure tablets with good strength.
2. MATERIALS AND METHODS
2.1. Materials
Ethambutol (Lupin, India), maize starch B.P., stearic acid (BDH, England), sodium metabisulphite, methanol, potassium hydroxide, sulphuric acid, sodium starch glycolate (Primogel®) (Qualikems, India), amylose (Sigma-Aldrich Inc. USA). Other chemicals used were of analytical grade and were used as supplied by the vendors.
2.2. Extraction
Sweet potatoes (Ipomoea batatas) were purchased from Ogige market, Nsukka, Nigeria. They were washed, peeled, rewashed and cut into small pieces and ground with a blender (Panasonic MX1511, Japan). The resulting pulp was soaked in 0.1% sodium meta-bisulphite solution to prevent oxidation and discoloration of the final product. It was then wet- sieved with a 200µm sieve to obtain the starch suspension called fruit water which was allowed to settle and the water decanted. This residue was treated with 0.1N KOH for 24 hours to remove ammonium or proteineous compounds from the starch after which it was copiously washed with water. The resulting starch was also treated with 0.1N H2SO4 for 12 hours to remove non nitrogenous substances such as minerals, washed severally again with water and dried in an oven at 50 oC for 6 hours.
The dried product was then defatted by suspending one part of it in three parts of 85 % methanol in a soxhlet apparatus where it was refluxed for one hour on a steam bath with occasional stirring, then filtering and digesting twice with fresh solvent.
2.3. Determination of organoleptic properties:
The extracted starch was observed physically for color, odor, taste and texture and these properties were noted.
2.4. Chemical identification:
A 0.05 ml quantity of iodine solution was added to 1 ml mucilage obtained by suspending 1 g of the dried starch in 50 ml of water and the suspension boiled for one minute and cooled. The change in color was noted.
2.5. Determination of loss on drying
A 1 g quantity of the potato starch was placed in a crucible of known weight and dried to a constant weight in an oven at 50 oC.
2.6. Moisture content
A 0.5 g quantity of the potato starch was heated in an oven set at 90 oC until a constant weight was obtained. The moisture content was then calculated on dry weight basis using the equation below:
where Wl is loss in weight and W is the original weight.
2.7. Amylose and Amylopectin Determination
Amylose content was determined by colorimetric method (William et al., 1970). A calibration plot of amylose was first prepared dissolving 100 mg quantity of amylose in 10 ml of 1%w/w NaOH in 100 ml volumetric flask and the volumetric flask was made up to the mark with distilled water. Different concentrations ranging from 10 µg -100 µg were prepared from the stock solution prepared. Color development was achieved by adding 5 ml of iodine solution and 1 ml of 0.1N HCl into each solution. The absorbance of each concentration was determined at 640 nm wavelength using digital spectrophotometer (Jenway 6405, England). A plot of absorbance against concentration (µg/ml) was used to obtain the standard calibration curve.
A 0.1g quantity of sweet potato starch was then weighed into a 100 ml volumetric flask and moistened with 2 ml absolute ethanol. The mixture was heated on a hot plate until a clear solution was obtained. This was made up to 100 ml with distilled water and used for amylose determination. A 5 ml aliquot of the above was mixed with 0.1 N HCl and 5 ml of iodine solution and made up to 100 ml. The mixture was allowed to stand for 20 minutes for maximum color development after which the absorbance was taken and the amylose content was determined from the calibration curve. The amylopectin content was then determined by subtracting the amylose content from 100 %.
2.8 Compaction behaviour of the Starch
Kawakita and Ludde model was used to study the densification behavior of the starch (Kawakita and Ludde, 1971). A known quantity of the starch was poured into a 25 ml measuring cylinder. The initial bulk volume Vo was recorded. The cylinder was tapped from the height of 1 cm from the bottom of the cylinder. The volume VN after Nth tapping (5, 10, 15, 20, 25) was recorded. The data were analysed using Kawakita and Ludde equation as shown below:
 Where C is the volume reduction at applied pressure P Vo is the initial volume and Vp is the volume at pressure P, and are constants. The equation can be rearranged to give the equation
2.9. Micromeritic Properties of Potato Starch
2.9.1. Bulk and Tapped Densities
Bulk density was calculated as the quotient of the powder’s weight and the bulk volume. Bulk volume was determined by pouring 20 g of the starch into a 50 ml measuring cylinder and the volume occupied by the 20 g of the starch was regarded as the bulk volume. Tapped density was the quotient of the weight and the tapped volume. Tapped volume was obtained by tapping the 20 g of the starch in 50 ml measuring cylinder to a constant volume.
HQ and CI were derived as per the equations below where Db and Dt were respectively bulk and tapped densities.
![]()
The percentage compressibility index (CI) was calculated as the ratio of the difference between tapped and bulk densities to the tapped density times 100.
2.9.2. Flow Rate and Angle of Repose
The flow rate of potato starch was determined together with the angle of repose. A plastic funnel with orifice diameter of 1 cm was fitted on to a retort stand with its tip 7.5 cm above a piece of paper placed under it on a flat horizontal surface. A 20 g sample of the potato starch was transferred into the funnel with its orifice closed with a ruler. On removal of the ruler, the orifice opened and the starch powder flowed out freely forming a heap on the white paper base. The time taken for the starch to flow out completely through the orifice was recorded. Flow rate was calculated as the weight of powder per second passing through the orifice (Eq.6).
![]()
Where w is the weight of the powder and T is the time of flow.
The mean height of the heap formed and the diameter of the heap were measured and used to calculate the angle of repose using the formulae stated below (Eq.7)
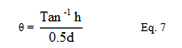
where θ was the angle of repose, h was height of heap formed and d was diameter of heap formed.
2.9.3. Particle True Density Determination
This was determined using fluid displacement technique (Armstrong et al., 1989). A 50 ml capacity clean and dried pycnometer and non solvent n-hexane were used to determine the true density. The weight of the pycnometer was noted. The density bottle was then filled with n-hexane and the new weight (W1) was noted. A known weight W (1 g) of the sweet potato starch was added and the weight of the n-hexane with the pycnometer and the sample was noted as (W2). True density was then calculated from the equation below.
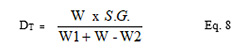
S.G. is the specific gravity of the non solvent n-hexane.
2.9.4. Packing Fraction
Packing fraction of a powder is the ratio of the bulk density to the true density.

where was the bulk density and was the true density of the potato starch.
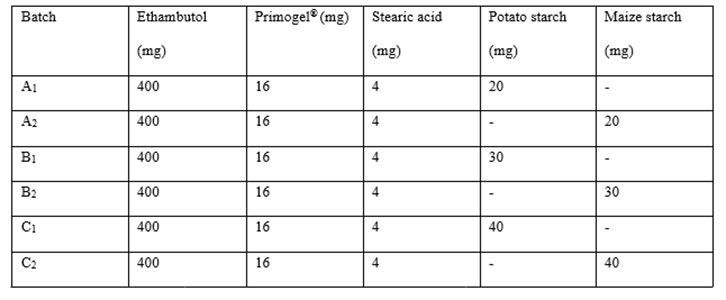
2.10. Preparation of the Ethambutol granules
The granules were prepared by wet granulation method using the sweet potato starch as a binder and a standard maize starch for comparison at 5, 7.5, and 10 % w/w as shown in Table 1. The drug and the excipients were weighed out using electronic digital balance (Ohaus, USA). A 20 % w/v mucilage of each starch was used as a binder to produce the granules respectively for the potato starch batches and the maize starch batches. In each batch the mucilage was used to wet mass the ethambutol and the Primogel® in a mortar with pestle. The wet mass was passed through 1.7 mm sieve and dried in an oven at 60 oC for 2 hours. The dried granules were then passed through a 1.00 mm sieve to obtain the granules which were stored in air tight containers.
Click to view
2.11. Evaluation of Ethambutol Granules
2.11.1 Determination of fines
The dried granules of ethambutol were separated into coarse and fine granules by shaking them in 250 µm mesh sieve. A 40 g quantity of each batch of the granules was transferred into a 250 µm mesh sieve and agitated. The percentage fine was the percentage of the granules that pass through 250 µm mesh sieve. The percentage fines was then calculated using the equation below:
![]()
2.11.2. Bulk and Tapped Densities
The bulk and tapped densities of the ethambutol granules were determined using the method previously used to determine that of the potato starch. A 20 g quantity of the granules was poured into 50 ml measuring cylinder and the initial volume (Vo) was recorded. The cylinder was then mechanically tapped from a height of 1 cm from the bottom of the cylinder until a constant volume was gotten and recorded as tapped volume (Vt). The bulk and tapped densities were calculated respectively as previously stated.
2.11.3. Hausners’s Quotient and Compressibility Index
The Hausner’s quotient and Carr’s compressibililty index of the ethambutol granules were calculated using equations 5 and 6 respectively.
2.11.4 Flow Rate and Angle of Repose
The flow rate and angle of repose of ethambutol granules were determined using the fixed height funnel method as was used to determine that of potato starch.
2.12. Compression of the ethambutol granules into tablets
Ethambutol tablets were produced by compressing the ethambutol granules into tablets with single punch tableting machine (Manesty Typte F3 No 181174, England) fitted with 9.5 mm punches. The 250 µm mesh size sieve was used to separate the fines from the granules. The fines was mixed with the calculated amount of the stearic acid for 3 minutes and then mixed with separated granule for another 2 minutes. The powder mix was compressed with the single punch machine stated above at a fixed compression pressure.
2.13 Evaluation of the Ethambutol Tablets
2.13.1 Tablet Diameter and Thickness
The diameter and thickness of the tablets produced using the potato starch and maize starch as binders were measured using vernier calipers. The mean diameter and thickness were calculated for each batch using random sample of 10 tablets from each batch.
2.13.2 Weight Uniformity
A random sample of twenty tablets was taken from each batch and the tablets were weighed individually using a digital electronic balance (Ohaus, USA). The mean weight, percentage deviation of each tablet from the mean and coefficient of variation were calculated for each batch.
2.13.3. Tablet Hardness (Crushing Strength)
Mosanto hardness tester (Erweka, Germany) was used to determine the force required to diametrically break each tablet from ten randomly selected tablets from each batch. The mean hardness and the standard deviations were calculated.
2.13.4. Tablet Friability
Twenty tablets were randomly selected from each batch, de-dusted and weighed using digital balance (Ohaus, USA). The tablets were placed in Roche friabilator and rotated for 4 minutes at the rate of 25 rotations per minute after which the tablets were de-dusted, reweighed and the percentage loss in weight or friability calculated using equation 11 below.
![]()
2.13.5. Tablet Disintegration Time
The disintegration time of six randomly selected tablets from each batch were determined using Erweka disintegration time apparatus (Erweka, Germany) with 0.1 N HCl as the disintegration medium and the equipment maintained at 37 ± 1 oC.
The mean time for the tablets to completely disintegrate and pass through the mesh into the disintegration medium was recorded. This was repeated for another random sample of 12 tablets from each batch and the disintegration time for each tablet and the mean for each batch with the standard deviation noted.
2.13.6. Dissolution rate test
Dissolution studies were carried out using the dissolution apparatus with paddle, (U.S.P. model 2 Erweka, Germany) with 0.1N HCl as the dissolution medium. A 900 ml volume of the dissolution medium was measured into the dissolution apparatus maintained at 37.0 ± 1.0oC. The machine was allowed to equilibrate for 30 minutes after which one tablet was introduced. A 5 ml volume of the dissolution medium was withdrawn after every 5 minutes and replaced with 5 ml of fresh 0.1 N HCl for 60 minutes. The samples withdrawn were then determined spectrophotometrically using digital spectrophotometer (Jenway 6405, England).
2.13.7. Content of Active Ingredient
A randomly selected 10 tablets from each batch were used for the content of active ingredient tests. The selected tablets were weighed individually and then together. They were then crushed and an amount equivalent to the average weight of the crushed tablets from each batch that was weighed out with an analytical balance. The weighed powder was dispersed in 100 ml of 0.1 NHCl. This was filtered and 1 ml of the filtrate was diluted to 100 ml and aliquots of the resultant filtrate was analysed by determining the absorbance and the concentration determined mathematically using the equation:

where C is the concentration, A is the absorbance, K is the slope of the Beer’s plot, Df is the dilution factor.
2.14. Statistical analysis
Data were recorded as means ± standard deviation (SD). One way analysis of variance (ANOVA) was performed on cumulative amount of drug released using IBM SPSS statistics 21 (New York, USA). Probability value (p-value) less than 0.05 was considered significant.
3. RESULTS AND DISCUSSION
3.1. Characterization of Sweet Potato Starch
The sweet potato starch was got from the suspension after decanting the supernatant and drying the sediment. The yield was 68.24g per 100 g corresponding to 68.24 % yield. Sweet potato starch was isolated as white, odorless, tasteless, powder with fine smooth texture. A cloudy mucilage was formed when the starch was dispersed in hot water. Addition of 1 ml iodine solution to a dispersion of the starch in water resulted in dark blue color being formed thus confirming the powder as starch powder. the loss on drying was found to be 7.8 %. However, B.P. 2004 recommends that that starch should not have loss on drying more than 15 %. Sweet potatoes are therefore potential source of pharmaceutical starch (B.P.2004).
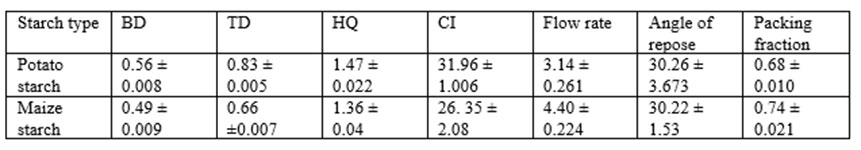
The bulk density was found to be 0.56 ±0.008 g/ml with particle density of 1.60 g/ml. The Hausner’s quotient and Carr’s compressibility index were respectively 1.47 ±0.022 and 31.96 ±1.006 % indicating that the starch was not of good flow (B.P. 2004). The bulk and tapped densities were low (Table 2) indicating low fluidity which is corroborated by HQ and CI values. Low bulk density is as a result of void created by large particles not being well filled by the smaller particles during redistribution and consolidation processes (Ingram and Lowenthal, 1972). The packing fraction of the sweet potato starch was found to be 0.73± 0.02 compared to 0.680 ± 0.0100 of maize starch. The maize starch was observed to have a better flow than that of sweet potato starch. The angles of repose for the two starches were in the range of 30 – 40o which indicate that they are passable (B.P. 2004).
The amylose content was found to be 24.4% and amylopectin content which was found by difference was 75.6%. Starch molecule is made up of two subunits the amylose subunit which constitute 15–30 % and the amylopectin subunit which constitute 70–85 %. The physicochemical properties of starch to a large extent depend on the amylose/amylopectin ratio (Manek et al, 2012). The amylose content of starch is usually 15 – 30 % while that of amylopectin content is usually 70 – 85 %. The binding properties of starch correlate with the amylose content with higher amylose content indicating higher binding effect.
3.2. Binding properties in ethambutol granules/tablets.
Ethambutol granules were prepared separately with sweet potato and maize starches. Using angle of repose, HQ, and CI as indices of flow batches prepared with maize starch had better flow compared to the batches prepared with sweet potato starch (Table 3). However, there is no significant difference in their actual flow rate through an orifice.
3.3 Micromeritic properties of the sweet potato starch
3.3.1. Bulk and Tapped Densities
The mean bulk and tapped densities of the sweet potato starch were 0.562 g/ml and 0.836 g/ml respectively. Those of the maize starch were 0.486 g/ml and 0.66 g/ml respectively. The HQ and CI for the sweet potato starch were 1.47 and 31.96 % respectively compared to 1.35 and 26.34 % respectively for maize starch (Table 2). The two starches did possess good flowability as shown by their HQ and CI indicator. The sweet potato starch also has higher particle density of 1.6 g/ml compared to that of 1.09 g/ml for maize starch.
3.3.2 Flow rate and Angle of Repose
The maize starch was observed to have a better flow than that of sweet potato starch. The angles of repose for the two starches were in the range of 30 – 40o which indicate that they are passable (B.P. 2004).
Click to view
3.3.3 Compressibility
Kawakita applied another equation (Eq. 13) describing the volume reduction on tapping and vibrating processes where the pressure P is replaced by tapping number N (Emeje et al., 2008). Constant a describes the compressibility and the constant 1/b describes the cohesive properties of powders or the fastness of how the final packing stage is achieved.
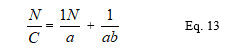
Where C = (Vo – VN )/ Vo or the volume reduction, Vo is the bulk volume, VN is the volume at a particular number of taps, = compactibility, b = cohesion, N = number of taps.
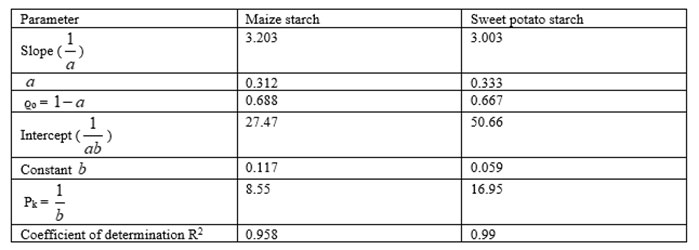
A graph of N/C versus N was plotted and the slope and intercept were used to obtain the constants: slope = 1/ and intercept = 1/b. It has been shown that a is related to the initial porosity ϱa and b has the dimension of reciprocal of stress.
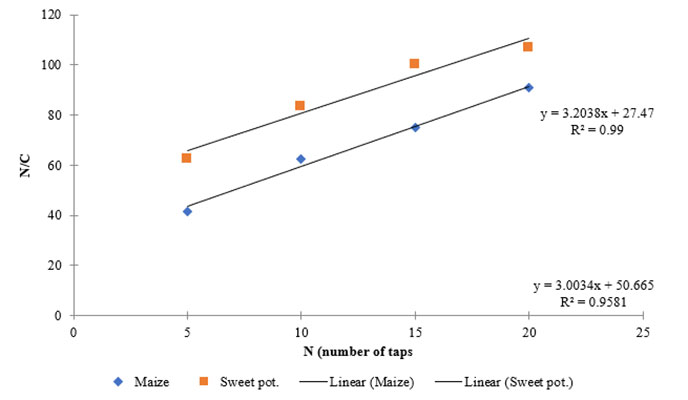
Kawakita plots of the two starches were linear and parallel with densification of the starches under tapping pressure (Fig.1). It shows that the two starches undergo deformation by plastic flow (York and Pilpel, 1973). The constant expresses the minimum porosity of powder before compression and the value indicate initial relative density ϱo. The constant also known as the coefficient of compression is related to the plasticity of the material. Its reciprocal express the pressure parameter Pk which is the pressure required to reduce the volume of powder by 50 %. The value Pk is inversely proportional to the degree of plastic deformation during compaction of materials that deform plastically. Lower values of Pk indicate higher degree of plastic deformation. It has been shown that smaller values of correlates with better fluidity and low values of Pk indicates reduction in cohesion and also soft materials that deform plastically under pressure (Alderborn and Nystrom, 1982). From Table it clear that smaller pressure was required to reduce the maize starch to 50% of its initial volume as shown by the Pk value than the sweet potato starch (Table 3). Also, the maize starch had lower value of which suggest better fluidity. However, the HQ and CI values of these two starches show that maize starch had better fluidity though they are not statistically significant (Table 2).
Click to view
Click to view
3.4. Micromeritic properties of the Ethambutol Granules
3.4.1. The Percentage fines
The percentage fines for all the batches ranged from 7.90 – 7.70 % which were satisfactory. The percentage fines were higher in the batches with lower concentration of the starches.
At equivalent concentration of the two starches batches with maize starch have lower percentages of fines compared to others with sweet potato starch (p < 0.05) which implied better binding effect even though the percentage fine is less 20 % which is the maximum allowed percentage of fines in tablet production (Troy and Beringer, 2006).
3.4.2. Bulk and Tapped Densities
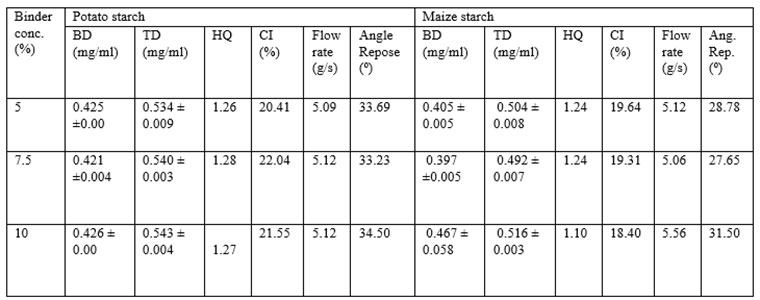
The batches containing maize starch at 5 and 7.5 % showed higher fluidity than those prepared with equivalent concentration of sweet potato starch as shown by the values of the HQ and CI (Table 4). Granules with HQ < 1.25 have excellent flow (B.P.2004). The HQ and CI indices for 5 and 7.5 % concentration of the sweet potato 1.26 and 1.28 and 20.41 and 22.04 compared to 1.24 and 1.24 and 19.64 and 19.31 for maize starch. At10 % concentration both starches exhibited higher HQ and CI showing that at that level there were decreased flowability. The lower HQ and CI seen among the granules compared to the pure starch could be as result of the effect of granulation.
3.4.3. Flow rate and Angle of Repose
The angles of repose for all the batches were in the range of 25 – 40o. At 5% and 7.5 % starch concentration batches containing maize starch had good flow (25 – 30o) while those containing potato starch had passable fluidity (30 – 40o). The 10 % concentrations of starch for both starches have higher angle of repose which implied lower fluidity (Table 4).
Click to view
3.5 Tablet properties of the formulations
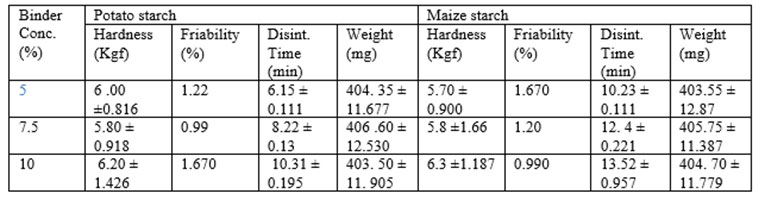
3.5.1 Hardness
The hardness of the batches is shown in Table 4. Binders impact cohesiveness to the granules and hence contribute to the overall hardness of the tablets (Chalapathi et al., 2010). Die filling and also compression pressure affect the hardness of tablets (Khar et al., 2013). At equivalent concentration there is no difference in the mean hardness of tablets prepared with sweet potato starch compared to those of maize starch.
3.5.2 Weight Uniformity
All the batches of tablets complied with B.P.2004 specifications for variation in weight for uncoated tablets. However, there was slight increase in mean weight of tablets with increasing binder concentration.
3.5.3 Friability
Binders tend to reduce the friability of tablets as it holds the granules together and impart cohesiveness into them. The tablets prepared with maize starch as the binder had decreasing friability with increasing concentration of the starch. The sweet potato starch batches did not follow any particular order as the 10 % concentration showed higher friability than 5 and 7.5 % concentration. However, unmodified starch has been shown not to compress well and increases tablet friability and capping if used in high concentration (Barmi et al., 2016). It may be that the optimum concentration of the sweet potato starch in ethambutol tablet may lie between 7.5 and 10 %.
3.5.5 Disintegration time of tablet
The disintegration time of the tablets prepared with the two binders increased with increasing binder concentration. Starch mucilage was found to form thin films around granules that increase in thickness with increasing concentration of the mucilage thereby retarding disintegration of tablets (Tsiege and Alexander, 1993). However, tablets prepared with sweet potato starch as the binder disintegrated relatively faster than those prepared with equivalent concentration of maize starch (table 5) but all of them were within 15 minutes specified in British Pharmacopoeia (B.P.2004).
Click to view
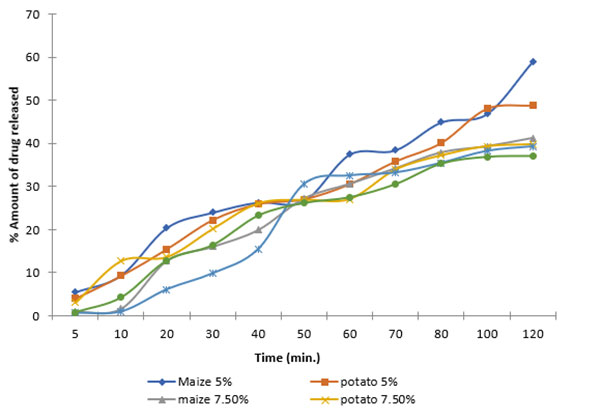
3.5.4. Dissolution Rate Studies
The release profiles of the batches of tablets prepared standard maize starch and the extracted sweet potato starch as binders show that there is correlation between binder concentration and the amount of drug released at concentration of 5 – 10%. However, there is no significant difference in the amount of drug released among the batches (p < 0.05). This shows that the release profile of ethambutol tablets prepared with standard maize starch as a binder is similar to those batches prepared with sweet potato starch extracted by us (Fig. 2)
Click to view
4. CONCLUSION
The findings of this study show that locally extracted starch from sweet potatoes (Ipomoea batatas) compared well with maize starch B.P. when used at equivalent concentrations in ethambutol tablets formulations. Sweet potato starch proved to be a good binder even though the maize starch showed greater effectiveness as binder there was no significant difference in their release properties when used at the same concentration in ethambutol formulations (p < 0.05). Tablets prepared with potato starch as binder had less disintegration time, higher friability and the granules had higher percentage of fines compared to those prepared with equivalent concentrations of maize starch, thus indicating that the binding properties of maize starch is slightly higher than that of potato starch.
CONFLICT OF INTEREST
There are no conflicts of interests among the authors with respect to this work.
ACKNOWLEDGEMENT
The authors are grateful to Mr Ofomata of National Centre for Energy Research and Development.
REFERENCES
Adebayo AS, Itiola OA. Evaluation of bread fruit and cocoyam starches as exodisintegrants in a paracetamol tablet formulation. Pharm. Pharmacol. Commun. 1998; 4: 385-389.
Adetunji OA, Odeniyi MA, Itiola OA. Mechanical and release properties of chloroquine phosphate tablets containing corn and trifoliate yam starch as binders. Tropical Journal of Pharmaceuical Research 2006; 5(2): 589 – 596.
Armstrong NA, Minchom CM, Patel VJ. Density determination of powder by liquid displacement methods. Drug Development and Industrial Pharmacy 1989; 15(4): 549 – 559.
Barmi Hartes, Sriwidodo, Marline Abdassah, Anise Yohana Chaerunisaa. Starch as a pharmaceutical excipient. International journal of Pharmaceutical Reviews and Research 2016; 41(2): 59 – 64.
Bos CE, Bolhuis GK, Doorne HV, Lerk CF. Nature starch in tablet formulations: Properties on compaction. Pharmaceutisch Weekblad 1987; 9(5): 274 – 282.
Canadian Food Inspection Agency (CFIA). The Biology of Solanum tuberosum (L.) (Potatoes) 2019; pp1-5. Accessed from: Https://www.inspection.gc.ca
Chalapathi V, YuvarajTV and Jaganathan A. Formulation of paracetamol tablets using a novel binder isolated from Manihot esculenta. L and its evaluation. International Journal of Chem Tech Research 2010; 2(1): 406-411.
Dessai PM, Liew C, Heng PWS. Review of disintegrants and the disintegration phenomena. Journal of Pharmaceutical Sciences 2016; XXX: 1 – 11.
Emeje M, Isimi C, Kunle O. Effect of Grewia gum on the mechanical properties of paracetamol tablets formulations. African Journal of Pharmacy and Pharmacology 2008; 2: 2001-2006.
Ibezim EC, Ofoefule SI, Omeje EO, Onyishi VI, Odo UE. The role of gingerstarch as a binder in acetaminophen tablets. Scientific Research and Essays 2008; 3(2): 046 – 050.
Juslin M, Kahela P, Paronen P, Turakka L. Comparative evaluation of starches as tablet adjuvant. Acta Pharma Fenn 1981; 90: 83 – 93.
Katzung BG(ed.) Basic and Clinical Pharmacology. MC Graw Hill, Eighth Edition, New York 2001: p. 807.
Kawakita K, Ludde KH. Some considerations on powder compression equations. Powder Technology 1970/1971; 4: 61.
Khar RK, Vyas SP, Ahmad FJ Jain GK (ed). Lachman/Lieberman’s The Theory and Practice of Industrial Pharmacy. CBS Publishers and Distributors Pvt Ltd, Fourth Edition, New Delhi 2013 p. 483.
Liebermann HA, Lachmann L. Pharmaceutical Dosage Forms: Tablets. Marcel Dekker Inc. New York 1989; (1): pp.131-148.
Manek RV, Builders PF, Kolling WM, Emeje M, Kunle OO. Physicochemical and binder properties of starch obtained from Cyperus esculentus. AAPS Pharm Sci Tech 2012; 13(2):379 – 388.
Musa H, Gambo A, Bhatia PG. Studies on some physicochemical properties of native and modified starches from Digitaria iburua and Zea mays. International Journal of Pharmacy and Pharmaceutical Sciences 2011; 3(1): 28 – 33.
Odeku OA, Awe OO, Popoola B, Odeniyi MA, Itiola OA. Mechanical properties of tablet formulations containing corn, sweet potato and cocoyarm starches as binders. Pharmaceutical Technology 2005; 29: 82 – 90.
Odeku OA, Pricker- Freyer KM. Analysis of the material and tablet formation properties of four Dioscorea starches. Starch/Stärke 2007; 59: 430 – 444.
Okunola A, Odeku AO. Evaluation of starches obtained from Dioscorea species as binding agent in chloroquine phosphate tablet formulations. Saudi Pharmaceutical Journal 2011, 19: 95 – 105.
Rahman SMM, Wheatley C, Rakshit, SK. Selection of sweet potato variety for high starch extraction. International Journal of Food Properties 2003; 6(3):419 – 430.
Troy DB, Beringer P.(ed). Remington: The Science and Practice of Pharmacy 21st Edition 2006, P.899 Lippincott Williams and Wilkins, Mryland, USA.
Tsige G, Alexander SN. Evaluation of starch obtained from Esente ventricosum as a binder and disintegrant for compressed tablets. J Pharm Pharmacol 1993; 45(307): 317-320.
William PC, Kuzina FD, Hlynka I. A rapid calorimetric procedure for estimating the amylose content of starches and flours. Cereal Chemistry 1970; 47(4): 411 – 420.